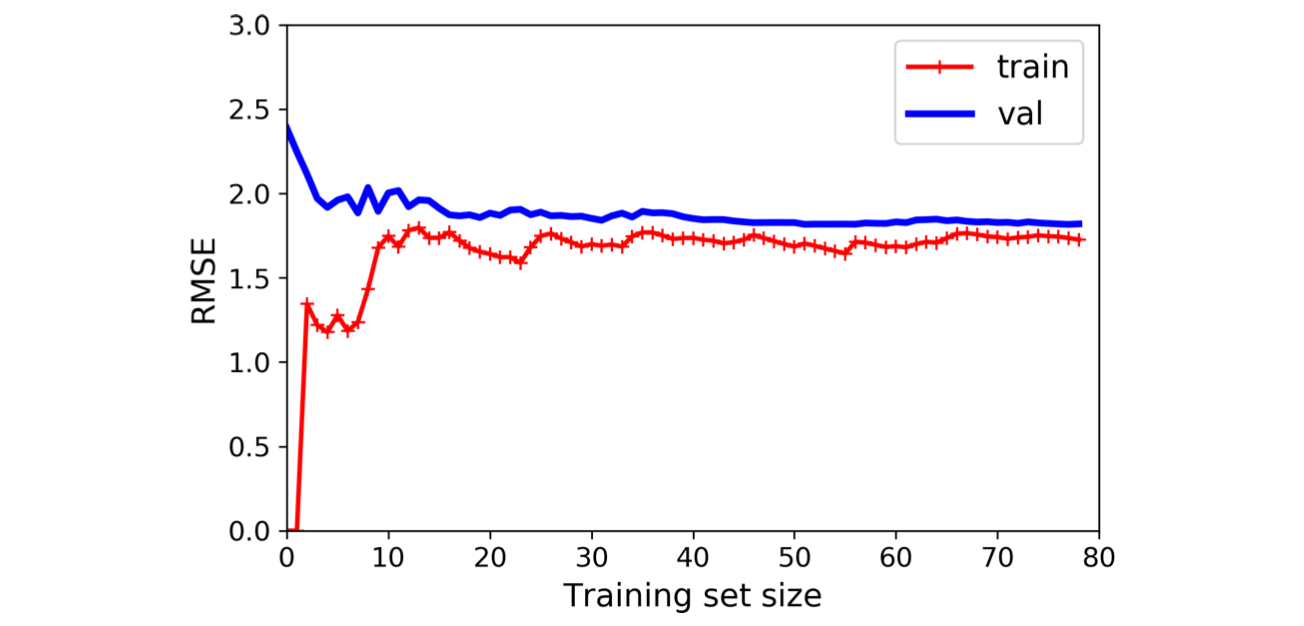
The training curve is measuring the cumulative error as more training instances are added. So where there are only 1 or 2 instances, the model is fitting perfectly resulting in 0 RMSE
The validation curve is measuring the cumulative error when applying the trained model to the full validation set, initially the model trained with small set size does not generalize well so the error is high but slowly approaches a the error of the training error
This is a typical graph of an underfitting model
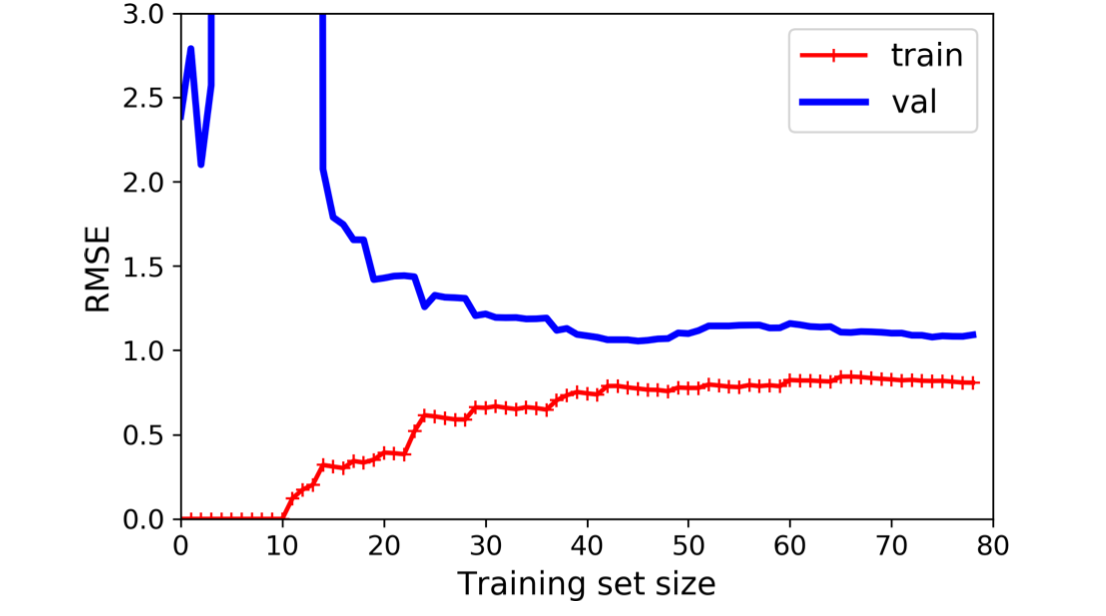
This model is trained using a 10th degree polynomial model and the validation error drops off much more